Don’t Ignore This Solana Price Rally
Solana (SOL) price has emerged once again as one of the most promising altcoins in the crypto market, with its price climbing steadily in July 2025. After weeks of sideways movement and a multi-month correction, SOL price is now showing strong bullish signals on the daily chart. Traders and investors are beginning to ask: is this just a relief rally or the start of a major breakout?
Backed by solid technical momentum, rising RSI, and a classic Elliott Wave structure, SOL price is now trading around $177—its highest level in weeks. But can it push through to $200 and even challenge the $220 resistance zone? In this article, we’ll analyze Solana’s price chart, key indicators, and Fibonacci targets to uncover where this rally might be heading next.
Solana Price Prediction: Is SOL Price Entering a New Bullish Leg?
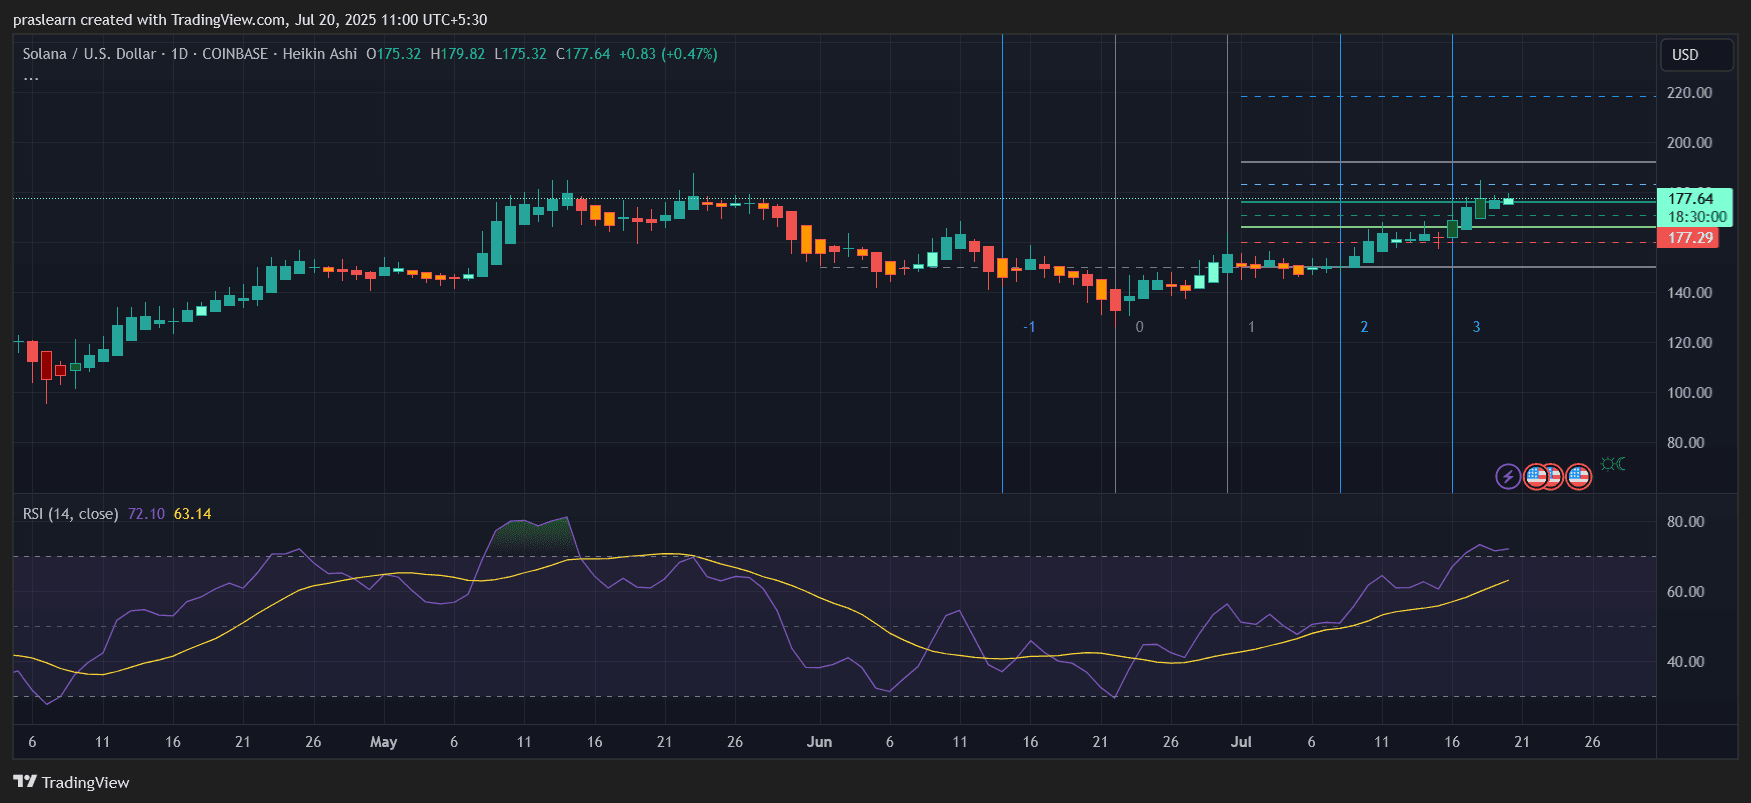
Solana (SOL) price is showing impressive strength on the daily chart, with a powerful breakout from a consolidation zone and consistent bullish Heikin Ashi candles forming higher highs. The current price sits at $177.64, reflecting steady upward momentum after rebounding from sub-$130 levels earlier this month. But is this rally sustainable? Let’s break down the technicals and see if SOL can power through to $200 and beyond.
What Does the RSI Say About Momentum?
One of the most crucial indicators to gauge trend strength is the Relative Strength Index (RSI). On the current chart:
RSI is at 72.10, which suggests the asset is entering overbought territory.
While an RSI above 70 typically signals caution, in trending markets—especially during crypto bull runs—RSI can remain elevated for extended periods without triggering reversals.
This RSI breakout is significant because it is supported by strong volume and bullish candle structure, hinting that this could be the start of a larger move rather than a temporary overextension.
What Are the Key Fibonacci Levels?
Using Fibonacci retracement and extension calculations based on the previous price swings:
- Local swing low: $122
- Recent breakout level: $160
- Current price: $177.64
Fibonacci extension targets become highly relevant now. Let’s calculate the 1.618 Fibonacci extension from the $122–$160 move:
1.618×(160−122)=1.618×38=61.5
Target=160+61.5=$221.5
This aligns closely with the dotted blue horizontal resistance line near $220 on the chart, confirming this level as a realistic short-term target.
What About Support and Risk Levels?
The chart also shows well-defined support and risk levels:
- Immediate support sits near $160, the recent breakout level.
- Invalidation zone lies just below $145, where previous higher lows were established.
As long as SOL price holds above $160, the bullish thesis remains intact. A break below $145 would suggest a failed breakout and potentially trigger a corrective wave.
Is Elliott Wave Impulse Driving the Rally?
The visible Elliott Wave count (marked 1-2-3) suggests that Solana price is in the middle of a Wave 3 rally. Wave 3 is typically the most powerful and extended, often pushing prices well beyond conservative targets. If Wave 1 spanned from $122 to $160 (a $38 move), and Wave 3 mirrors this or exceeds it:
Wave3Target=145+1.618×38=145+61.5=$206.5
This confirms $205–$220 as a likely zone where Wave 3 could complete, followed by a mild correction in Wave 4.
Solana Price Prediction for July 2025
Based on the RSI, Fibonacci extension, and Elliott Wave theory, Solana price is poised for a continued move upward. If the bullish momentum sustains and Bitcoin remains stable:
- Short-term target: $200
- Mid-term target: $220–$225
- Support to watch: $160
- Bearish invalidation: Below $145
This breakout is not just a random push—it is backed by structure, momentum, and technical confirmation. The odds are clearly tilting in favor of the bulls.
Looking to Buy SOL? Try OKX
OKX is a top choice to buy SOL. With low trading fees, extensive token listings, and an intuitive interface, it’s a preferred platform for many crypto traders across Europe.
Special Promotion – Limited Time
Until September 14, 2025, OKX is hosting an exclusive McLaren F1 Team giveaway:
--> Receive a complimentary McLaren F1 Team cap<--
Enter to win a VIP trackside experience in Zandvoort (Aug 29–31)
This offer is open to all new European users who haven’t yet traded on OKX. Don’t wait – claim your reward today!
$SOL, $Solana, $SOLPrice, $SolanaPrice
Read More
Don’t Ignore This Solana Price Rally
Solana (SOL) price has emerged once again as one of the most promising altcoins in the crypto market, with its price climbing steadily in July 2025. After weeks of sideways movement and a multi-month correction, SOL price is now showing strong bullish signals on the daily chart. Traders and investors are beginning to ask: is this just a relief rally or the start of a major breakout?
Backed by solid technical momentum, rising RSI, and a classic Elliott Wave structure, SOL price is now trading around $177—its highest level in weeks. But can it push through to $200 and even challenge the $220 resistance zone? In this article, we’ll analyze Solana’s price chart, key indicators, and Fibonacci targets to uncover where this rally might be heading next.
Solana Price Prediction: Is SOL Price Entering a New Bullish Leg?
Solana (SOL) price is showing impressive strength on the daily chart, with a powerful breakout from a consolidation zone and consistent bullish Heikin Ashi candles forming higher highs. The current price sits at $177.64, reflecting steady upward momentum after rebounding from sub-$130 levels earlier this month. But is this rally sustainable? Let’s break down the technicals and see if SOL can power through to $200 and beyond.
What Does the RSI Say About Momentum?
One of the most crucial indicators to gauge trend strength is the Relative Strength Index (RSI). On the current chart:
RSI is at 72.10, which suggests the asset is entering overbought territory.
While an RSI above 70 typically signals caution, in trending markets—especially during crypto bull runs—RSI can remain elevated for extended periods without triggering reversals.
This RSI breakout is significant because it is supported by strong volume and bullish candle structure, hinting that this could be the start of a larger move rather than a temporary overextension.
What Are the Key Fibonacci Levels?
Using Fibonacci retracement and extension calculations based on the previous price swings:
- Local swing low: $122
- Recent breakout level: $160
- Current price: $177.64
Fibonacci extension targets become highly relevant now. Let’s calculate the 1.618 Fibonacci extension from the $122–$160 move:
1.618×(160−122)=1.618×38=61.5
Target=160+61.5=$221.5
This aligns closely with the dotted blue horizontal resistance line near $220 on the chart, confirming this level as a realistic short-term target.
What About Support and Risk Levels?
The chart also shows well-defined support and risk levels:
- Immediate support sits near $160, the recent breakout level.
- Invalidation zone lies just below $145, where previous higher lows were established.
As long as SOL price holds above $160, the bullish thesis remains intact. A break below $145 would suggest a failed breakout and potentially trigger a corrective wave.
Is Elliott Wave Impulse Driving the Rally?
The visible Elliott Wave count (marked 1-2-3) suggests that Solana price is in the middle of a Wave 3 rally. Wave 3 is typically the most powerful and extended, often pushing prices well beyond conservative targets. If Wave 1 spanned from $122 to $160 (a $38 move), and Wave 3 mirrors this or exceeds it:
Wave3Target=145+1.618×38=145+61.5=$206.5
This confirms $205–$220 as a likely zone where Wave 3 could complete, followed by a mild correction in Wave 4.
Solana Price Prediction for July 2025
Based on the RSI, Fibonacci extension, and Elliott Wave theory, Solana price is poised for a continued move upward. If the bullish momentum sustains and Bitcoin remains stable:
- Short-term target: $200
- Mid-term target: $220–$225
- Support to watch: $160
- Bearish invalidation: Below $145
This breakout is not just a random push—it is backed by structure, momentum, and technical confirmation. The odds are clearly tilting in favor of the bulls.
Looking to Buy SOL? Try OKX
OKX is a top choice to buy SOL. With low trading fees, extensive token listings, and an intuitive interface, it’s a preferred platform for many crypto traders across Europe.
Special Promotion – Limited Time
Until September 14, 2025, OKX is hosting an exclusive McLaren F1 Team giveaway:
--> Receive a complimentary McLaren F1 Team cap<--
Enter to win a VIP trackside experience in Zandvoort (Aug 29–31)
This offer is open to all new European users who haven’t yet traded on OKX. Don’t wait – claim your reward today!
$SOL, $Solana, $SOLPrice, $SolanaPrice
Read More