XRP Price Trims Gains After Rally – Is This Just a Healthy Correction?
XRP price started a downside correction from the $3.650 zone. The price is now trading below $3.30 and remains at risk of more losses.
- XRP price started a downside correction below the $3.50 zone.
- The price is now trading below $3.450 and the 100-hourly Simple Moving Average.
- There is a key bearish trend line forming with resistance at $3.30 on the hourly chart of the XRP/USD pair (data source from Kraken).
- The pair could start another increase if it stays above the $3.050 zone.
XRP Price Dips Further
XRP price started a fresh decline after it failed to clear the $3.650 resistance zone, like Bitcoin and Ethereum. The price declined below the $3.450 and $3.350 support levels.
The decline was such that the price traded below the $3.120 level. A low was formed at $3.050 and the price is now consolidating losses near the 23.6% Fib retracement level of the recent decline from the $3.650 swing high to the $3.050 low.
The price is now trading below $3.450 and the 100-hourly Simple Moving Average. There is also a key bearish trend line forming with resistance at $3.30 on the hourly chart of the XRP/USD pair.
On the upside, the price might face resistance near the $3.2320 level. The first major resistance is near the $3.2650 level. A clear move above the $3.2650 resistance might send the price toward the $3.350 resistance or the 50% Fib retracement level of the recent decline from the $3.650 swing high to the $3.050 low.
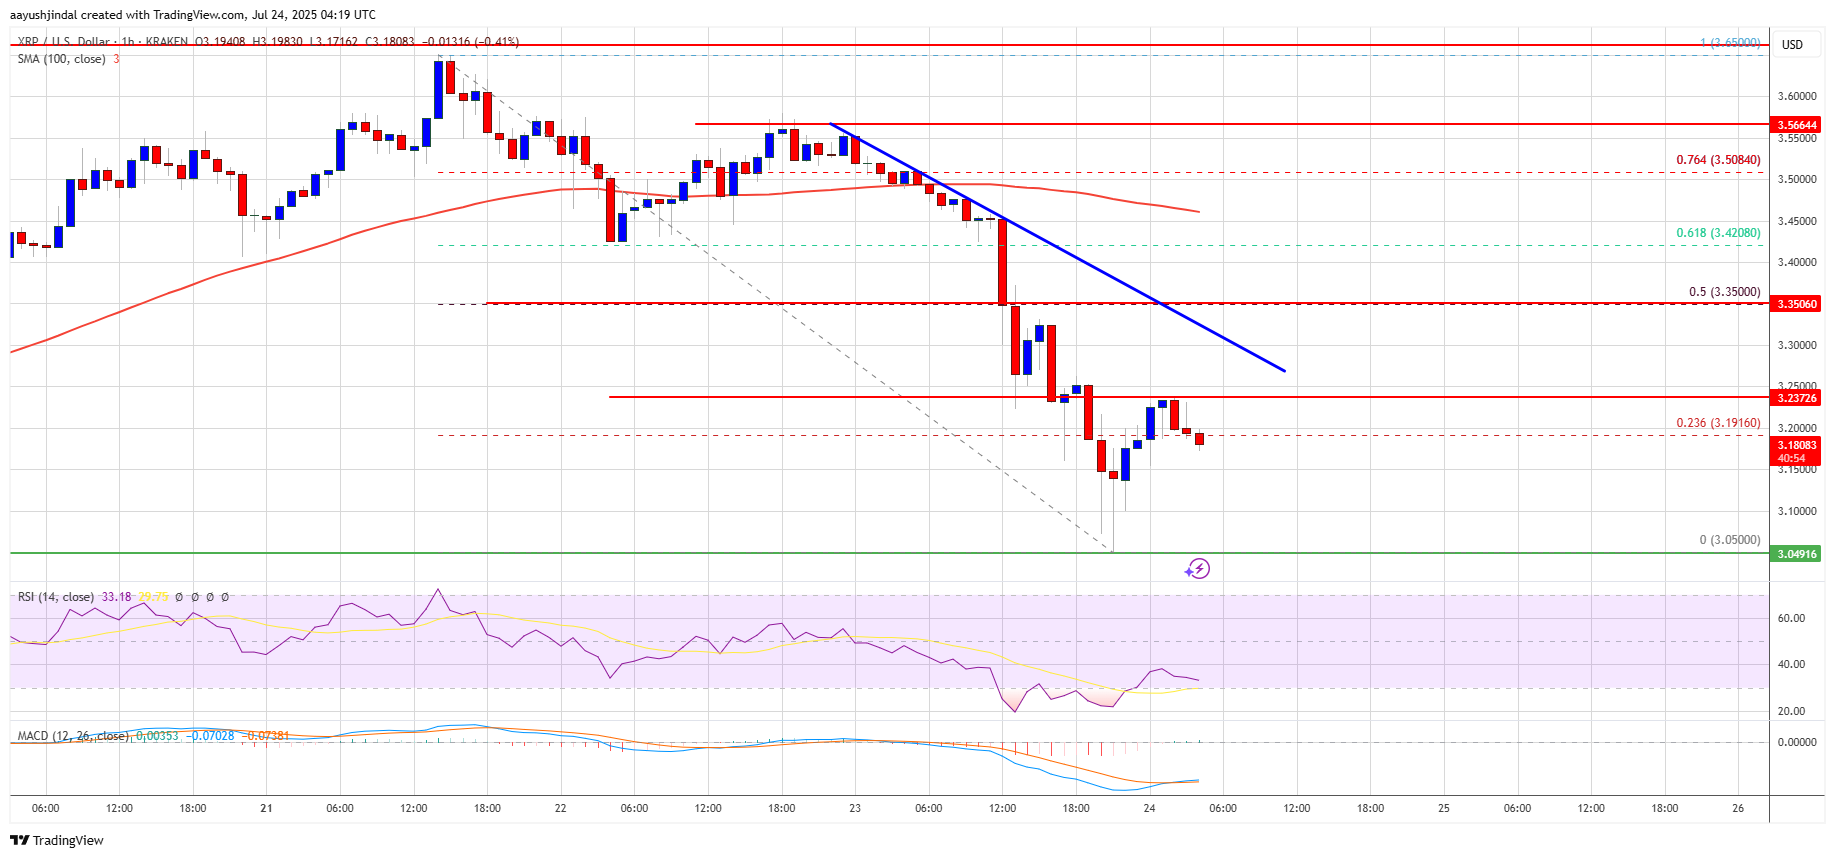
Any more gains might send the price toward the $3.450 resistance or even $3.50 in the near term. The next major hurdle for the bulls might be near the $3.650 zone.
Another Drop?
If XRP fails to clear the $3.350 resistance zone, it could start another decline. Initial support on the downside is near the $3.150 level. The next major support is near the $3.120 level.
If there is a downside break and a close below the $3.120 level, the price might continue to decline toward the $3.050 support. The next major support sits near the $3.00 zone.
Technical Indicators
Hourly MACD – The MACD for XRP/USD is now losing pace in the bearish zone.
Hourly RSI (Relative Strength Index) – The RSI for XRP/USD is now below the 50 level.
Major Support Levels – $3.120 and $3.050.
Major Resistance Levels – $3.250 and $3.350.
Read More

YouTube XRP Scams On The Rise After Record-Breaking Price Rally, Ripple CEO Warns
XRP Price Trims Gains After Rally – Is This Just a Healthy Correction?
XRP price started a downside correction from the $3.650 zone. The price is now trading below $3.30 and remains at risk of more losses.
- XRP price started a downside correction below the $3.50 zone.
- The price is now trading below $3.450 and the 100-hourly Simple Moving Average.
- There is a key bearish trend line forming with resistance at $3.30 on the hourly chart of the XRP/USD pair (data source from Kraken).
- The pair could start another increase if it stays above the $3.050 zone.
XRP Price Dips Further
XRP price started a fresh decline after it failed to clear the $3.650 resistance zone, like Bitcoin and Ethereum. The price declined below the $3.450 and $3.350 support levels.
The decline was such that the price traded below the $3.120 level. A low was formed at $3.050 and the price is now consolidating losses near the 23.6% Fib retracement level of the recent decline from the $3.650 swing high to the $3.050 low.
The price is now trading below $3.450 and the 100-hourly Simple Moving Average. There is also a key bearish trend line forming with resistance at $3.30 on the hourly chart of the XRP/USD pair.
On the upside, the price might face resistance near the $3.2320 level. The first major resistance is near the $3.2650 level. A clear move above the $3.2650 resistance might send the price toward the $3.350 resistance or the 50% Fib retracement level of the recent decline from the $3.650 swing high to the $3.050 low.
Any more gains might send the price toward the $3.450 resistance or even $3.50 in the near term. The next major hurdle for the bulls might be near the $3.650 zone.
Another Drop?
If XRP fails to clear the $3.350 resistance zone, it could start another decline. Initial support on the downside is near the $3.150 level. The next major support is near the $3.120 level.
If there is a downside break and a close below the $3.120 level, the price might continue to decline toward the $3.050 support. The next major support sits near the $3.00 zone.
Technical Indicators
Hourly MACD – The MACD for XRP/USD is now losing pace in the bearish zone.
Hourly RSI (Relative Strength Index) – The RSI for XRP/USD is now below the 50 level.
Major Support Levels – $3.120 and $3.050.
Major Resistance Levels – $3.250 and $3.350.
Read More