Bitcoin (BTC) Price Prediction for July 31

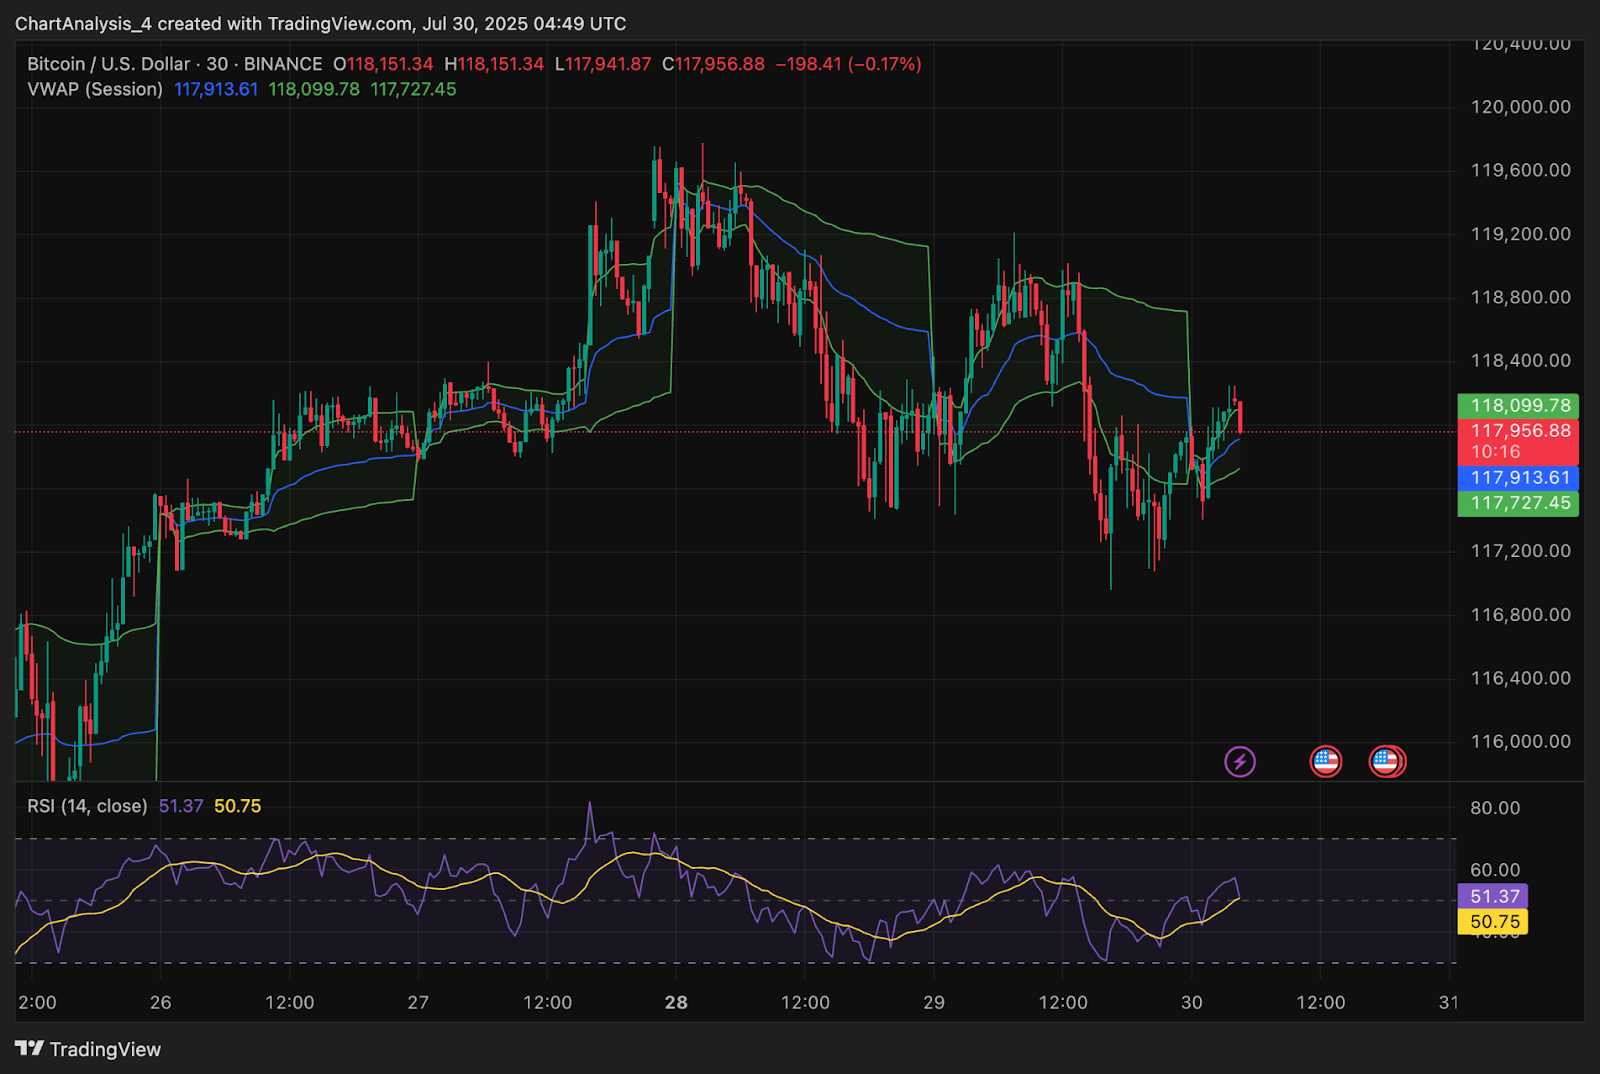
The Bitcoin price today is hovering near $117,968, caught between a narrowing triangle formation just ahead of a potential breakout. Over the last 72 hours, BTC has consolidated tightly between $117,000 and $118,700, with traders bracing for a volatility expansion. The current setup presents a crucial inflection point as the apex of the pattern nears.
What’s Happening With Bitcoin’s Price?

The 4-hour chart shows Bitcoin price trading inside a converging symmetrical triangle, with dynamic support around $117,000 and resistance at $118,700. The upper resistance of the triangle aligns with a prior supply zone between $120,000 and $121,600, while the lower bound of the structure aligns with recent higher lows formed since July 25.
Notably, Parabolic SAR dots remain above the latest candles, signaling trend weakness. However, BTC has managed to defend the ascending trendline repeatedly, suggesting bulls are still active within this compression. The structure points to an imminent breakout before August 1, with a breakout direction likely defining the next multi-day trend.
Why Is The Bitcoin Price Going Down Today?
The post Bitcoin (BTC) Price Prediction for July 31 appeared first on Coin Edition.
Read More

Bitcoin (BTC) Price Prediction for July 30

Bitcoin (BTC) Price Prediction for July 31
The Bitcoin price today is hovering near $117,968, caught between a narrowing triangle formation just ahead of a potential breakout. Over the last 72 hours, BTC has consolidated tightly between $117,000 and $118,700, with traders bracing for a volatility expansion. The current setup presents a crucial inflection point as the apex of the pattern nears.
What’s Happening With Bitcoin’s Price?
The 4-hour chart shows Bitcoin price trading inside a converging symmetrical triangle, with dynamic support around $117,000 and resistance at $118,700. The upper resistance of the triangle aligns with a prior supply zone between $120,000 and $121,600, while the lower bound of the structure aligns with recent higher lows formed since July 25.
Notably, Parabolic SAR dots remain above the latest candles, signaling trend weakness. However, BTC has managed to defend the ascending trendline repeatedly, suggesting bulls are still active within this compression. The structure points to an imminent breakout before August 1, with a breakout direction likely defining the next multi-day trend.
Why Is The Bitcoin Price Going Down Today?
The post Bitcoin (BTC) Price Prediction for July 31 appeared first on Coin Edition.
Read More