Polkadot Price Lags: Can DOT Establish a Base for Recovery?

Polkadot (DOT) is struggling below $5.00 against the US Dollar. The price must settle above the $4.35 and $4.50 resistance levels to start a decent increase.
- DOT declined steadily below the $5.50 and $5.00 levels against the US Dollar.
- The price is trading below the $5.00 zone and the 100-hourly simple moving average.
- There was a break above a connecting bearish trend line with resistance at $4.18 on the hourly chart of the DOT/USD pair (data source from Kraken).
- The pair could start a decent upward move if it settles above $4.35 and then $4.50.
Polkadot Price Remains In The Red Zone
In the past few weeks, DOT price saw a steady decline from well above $6.50. Bitcoin and Ethereum were stable, but Polkadot remained in the red zone. There was a close below the $5.00 level.
Finally, the price tested the $4.00 zone. A low was formed at $4.03 and the price recently started a recovery wave. There was a move above the $4.10 and $4.15 resistance levels. The price climbed above the 23.6% Fib retracement level of the downward move from the $4.65 swing high to the $4.03 low.
There was also a break above a connecting bearish trend line with resistance at $4.18 on the hourly chart of the DOT/USD pair. DOT is now trading below the $4.50 zone and the 100 simple moving average (4 hours).
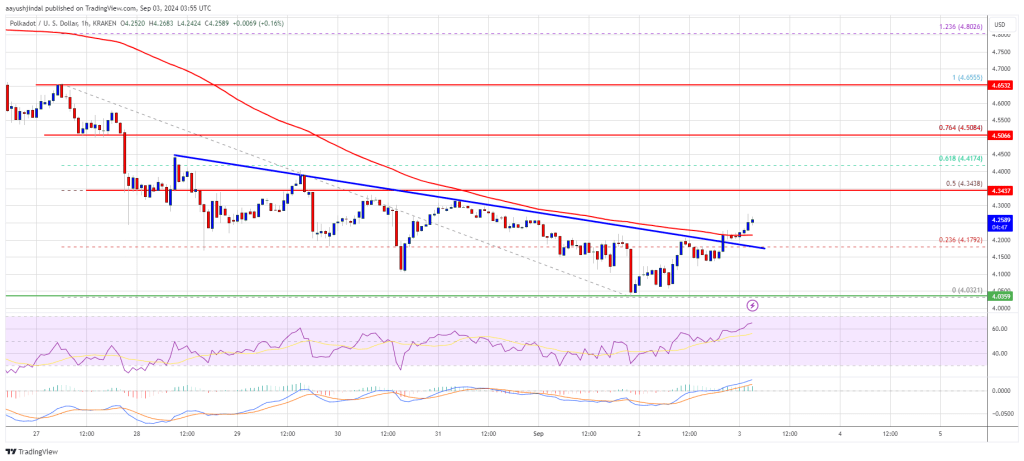
Immediate resistance is near the $4.30 level. The next major resistance is near $4.35 or the 50% Fib retracement level of the downward move from the $4.65 swing high to the $4.03 low. A successful break above $4.35 could start another strong rally. In the stated case, the price could easily rally toward $4.50 in the near term. The next major resistance is seen near the $5.00 zone.
Another Decline in DOT?
If DOT price fails to start a fresh increase above $4.35, it could start another decline. The first key support is near the $4.15 level.
The next major support is near the $4.10, below which the price might decline to $4.00. Any more losses may perhaps open the doors for a move toward the $3.85 support zone or $3.60.
Technical Indicators
Hourly MACD – The MACD for DOT/USD is now gaining momentum in the bullish zone.
Hourly RSI (Relative Strength Index) – The RSI for DOT/USD is now above the 50 level.
Major Support Levels – $4.15 and $4.00.
Major Resistance Levels – $4.35 and $4.50.
Read More

Massive Polkadot (DOT) Rally Ahead? Here’s What’s Driving It

Polkadot's DOT Faces Bearish Pressure Despite Recovery Attempts
Polkadot Price Lags: Can DOT Establish a Base for Recovery?
Polkadot (DOT) is struggling below $5.00 against the US Dollar. The price must settle above the $4.35 and $4.50 resistance levels to start a decent increase.
- DOT declined steadily below the $5.50 and $5.00 levels against the US Dollar.
- The price is trading below the $5.00 zone and the 100-hourly simple moving average.
- There was a break above a connecting bearish trend line with resistance at $4.18 on the hourly chart of the DOT/USD pair (data source from Kraken).
- The pair could start a decent upward move if it settles above $4.35 and then $4.50.
Polkadot Price Remains In The Red Zone
In the past few weeks, DOT price saw a steady decline from well above $6.50. Bitcoin and Ethereum were stable, but Polkadot remained in the red zone. There was a close below the $5.00 level.
Finally, the price tested the $4.00 zone. A low was formed at $4.03 and the price recently started a recovery wave. There was a move above the $4.10 and $4.15 resistance levels. The price climbed above the 23.6% Fib retracement level of the downward move from the $4.65 swing high to the $4.03 low.
There was also a break above a connecting bearish trend line with resistance at $4.18 on the hourly chart of the DOT/USD pair. DOT is now trading below the $4.50 zone and the 100 simple moving average (4 hours).
Immediate resistance is near the $4.30 level. The next major resistance is near $4.35 or the 50% Fib retracement level of the downward move from the $4.65 swing high to the $4.03 low. A successful break above $4.35 could start another strong rally. In the stated case, the price could easily rally toward $4.50 in the near term. The next major resistance is seen near the $5.00 zone.
Another Decline in DOT?
If DOT price fails to start a fresh increase above $4.35, it could start another decline. The first key support is near the $4.15 level.
The next major support is near the $4.10, below which the price might decline to $4.00. Any more losses may perhaps open the doors for a move toward the $3.85 support zone or $3.60.
Technical Indicators
Hourly MACD – The MACD for DOT/USD is now gaining momentum in the bullish zone.
Hourly RSI (Relative Strength Index) – The RSI for DOT/USD is now above the 50 level.
Major Support Levels – $4.15 and $4.00.
Major Resistance Levels – $4.35 and $4.50.
Read More
Massive Polkadot (DOT) Rally Ahead? Here’s What’s Driving It